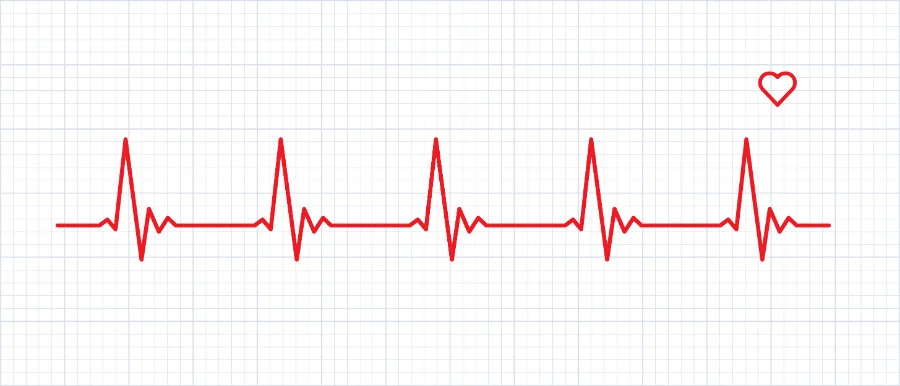
Electrocardiogram (ECG) monitoring is a vital tool extensively used in the medical field due to several reasons:
- Quick Diagnosis: ECG rhythms can provide immediate insight into a patient’s cardiac status. It helps identify life-threatening conditions like myocardial infarction (heart attack), arrhythmias, or other cardiac abnormalities.
- Guiding Treatment: Many emergency treatments depend on an accurate understanding of ECG rhythms. For instance, the decision to defibrillate a patient in cardiac arrest depends on identifying ventricular fibrillation or ventricular tachycardia on the ECG.
- Monitoring Patient Status: ECGs also serve as a continuous monitoring tool for paramedics, helping track patient status and treatment effectiveness during transport. Changes in the ECG rhythm can signal a change in patient condition.
- Prevention of Deterioration: Early identification of an abnormal ECG rhythm can help prevent further patient deterioration. Conditions like atrial fibrillation, if untreated, may lead to stroke or heart failure.
- Communication with Medical Team: Understanding ECG rhythms inside out also facilitates better communication with the hospital-based team. Paramedics can relay pertinent findings accurately, leading to a smoother handover and transition of care.
Given these reasons, a solid understanding of ECG rhythm interpretation is crucial for any paramedic or EMT. It can make the difference between life and death in many emergency situations. This article aims to provide a comprehensive guide to ECG rhythm interpretation, focusing on essential components and systematic approaches.
ECG Basics: Leads, Waves, and Intervals
First and foremost, one must grasp the fundamentals of ECG tracing. An ECG obtains electrical signals from the heart using 12 leads, which provide a perspective on the heart’s electrical activity from various angles. These leads produce a series of waves (P wave, QRS complex, and T wave) and intervals (PR interval, ST segment, and QT interval) that build the framework for ECG interpretation.
The P wave signifies the initiation of electrical activity – the atrial depolarization, followed by the PR interval, representing the time taken for the impulse to travel from the atria to the ventricles. The QRS complex reflects the ventricular depolarization, while the T wave corresponds to ventricular repolarization. The ST segment and QT interval provide further information about the ventricular conduction system.
Systematic Approach to ECG Interpretation
A systematic approach to ECG interpretation involves the following steps:
- Calculating the heart rate: To calculate the heart rate, measure the distance between consecutive R waves (RR interval) and apply the “300, 150, 100, 75, 60, 50” rule. Divide 300 by the number of large squares between R waves to estimate the rate (beats per minute). Additionally, examine if the rhythm is regular or irregular, affecting the consistency of RR intervals.
- Analyzing the P waves: Assess the presence, morphology, and consistency of P waves. Normal P waves should be upright and uniform in leads I, II, and aVF.
- Determining the PR interval: Measure the distance between the onset of a P wave and the beginning of the QRS complex, which should range between three to five small squares (0.12 to 0.20 seconds) in duration for optimal atrioventricular (AV) conduction.
- Examining the QRS complex: Evaluate the QRS complex’s width, amplitude, and morphology. A broad QRS complex indicates ventricular conduction disturbances, while a low amplitude could suggest decreased ventricular muscle mass or poor electrode placement.
- Inspecting the ST segment and T wave: The ST segment should be isoelectric (equal to the baseline), while the T wave should be upright and asymmetrical. Deviations from these norms may indicate myocardial ischemia, injury, or electrolyte disturbances.
- Assessing the QT interval: Measure the distance between the beginning of the QRS complex and the end of the T wave. A prolonged QT interval can be indicative of ventricular arrhythmias, electrolyte imbalances, or certain medications.
Common ECG Rhythm Abnormalities
By following the systematic approach, healthcare providers can identify various ECG abnormalities, such as:
- Sinus rhythms: These include normal sinus rhythm, sinus bradycardia (heart rate < 60 bpm), sinus tachycardia (heart rate > 100 bpm), and sinus arrhythmia (varied RR intervals).
- Atrial rhythms: Atrial fibrillation (irregularly irregular rhythm with no discernible P waves), atrial flutter (sawtooth pattern with rapid atrial rate), and supraventricular tachycardia (narrow QRS complex and undetectable P waves) are among the frequently encountered atrial rhythms.
- AV blocks: These can be first-degree (prolonged PR interval), second-degree (progressively longer PR intervals leading to a blocked QRS complex), or third-degree (complete dissociation between P waves and QRS complexes).
- Ventricular rhythms: Examples include ventricular tachycardia (broad QRS complex with rate > 100 bpm) and ventricular fibrillation (erratic waveform with absent QRS complexes).
ECG rhythm interpretation is an indispensable skill for healthcare providers to deliver adequate patient care. By understanding the fundamental components of an ECG and following a systematic approach, practitioners can accurately diagnose cardiac abnormalities, monitor patients’ conditions, and make informed treatment decisions. Constant practice and maintaining up-to-date knowledge on ECG interpretation are essential for success in this critical aspect of patient care.

